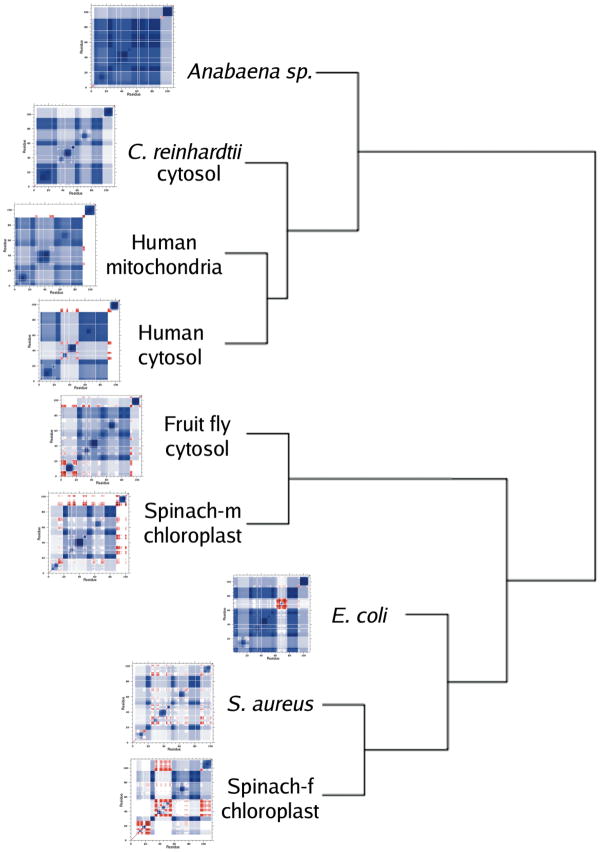
Figure 7.
Cooperativity correlation plots describing intramolecular couplings for the nine oxidized thioredoxins. Blue regions indicate the extent that two residues are simultaneously within the same rigid cluster. Red regions indicate the extent that two residues exist within the same flexible region where the flexibility contiguously propagates. White indicates no correlation between two residues in regards to their rigidity and flexibility. While some similarity in patterns can be seen, the details of each protein are quite distinct. The presented dendrogram describes the hierarchical clustering of a correlation matrix constructed from all 36 pairwise comparisons using the Pearson correlation coefficient. In all cases but one, clustering preserves the relative values of θRP and θnat.

