
Figure 1. The thymus represents a chemoprotective niche that harbors surviving lymphoma cells following doxorubicin treatment.
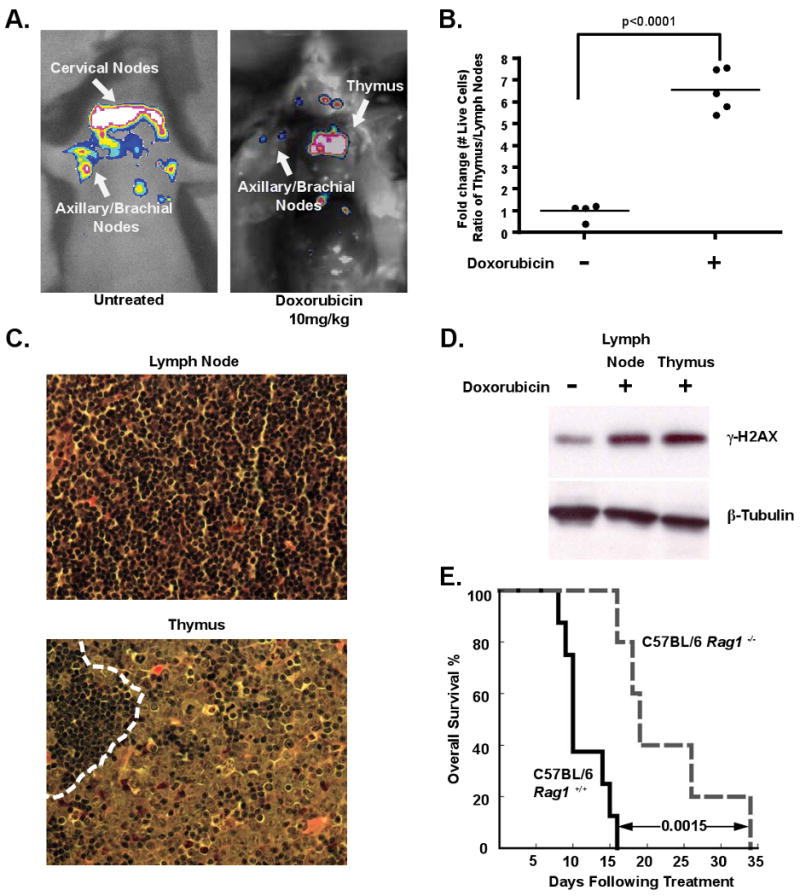
(A) Lymphoma-bearing mice were imaged for whole body fluorescence prior to treatment and 4 days following a single dose of 10mg/kg doxorubicin. Representative mice are shown. (B) Ratios of live GFP-tagged Eμ-myc p19Arf-/- B lymphoma cells in the thymus versus peripheral lymph nodes were quantified by flow cytometry, before (n=4 mice) and 48 hours after (n=5 mice) doxorubicin treatment. Average ratios are indicated with a line. (C) Hematoxylin and eosin (H&E) sections of lymph node and thymus from a tumor-bearing bearing mouse 48 hours after doxorubicin treatment. The dotted line in the thymus demarcates a small region of infiltrating lymphocytes neighboring a larger region of surviving lymphoma cells. Representative fields are shown at 40× magnification. (D) A western blot showing γ-H2AX levels in FACS sorted GFP-positive lymphoma cells from the thymus and peripheral lymph nodes following doxorubicin treatment. β-Tubulin serves as a loading control. The untreated sample is a lysate from cultured lymphoma cells. (E) A Kaplan-Meier curve showing the overall survival of tumor-bearing C57BL/6 (n=8) or C57BL/6 Rag1-/- (n=5) mice following doxorubicin treatment. The p value was calculated using a logrank test. See also Figure S1.