2).

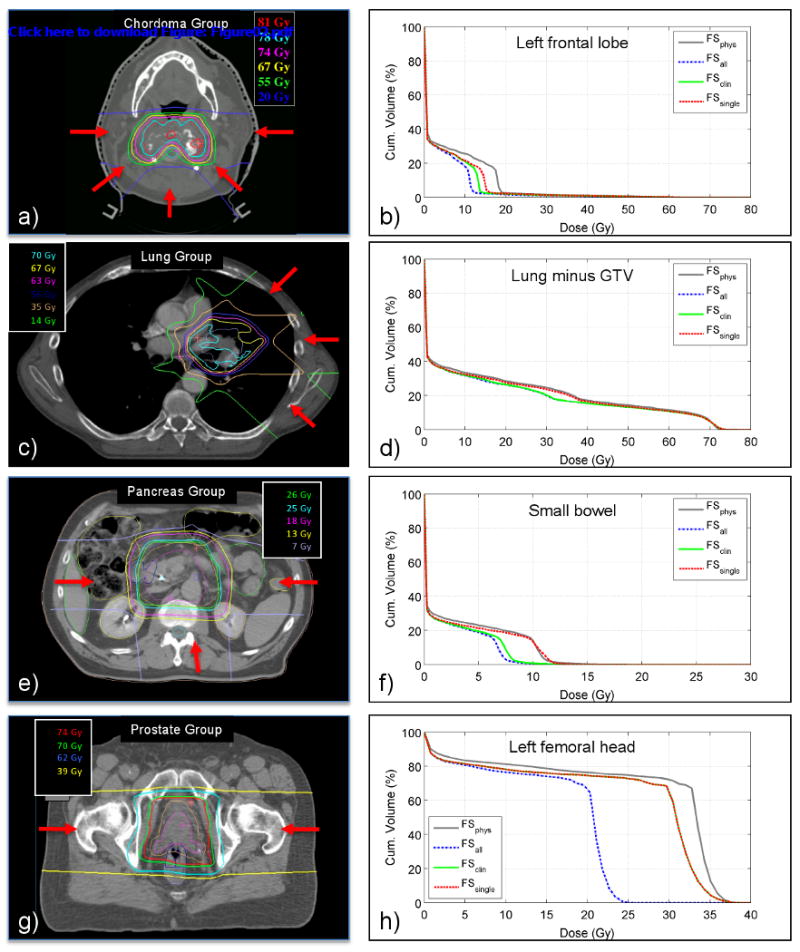
The left column shows typical dose distributions, not corrected for dose per fraction, for the Chordoma Group, Lung Group, Pancreas group and Prostate Group, respectively. Arrows indicate some of the beam directions used in the treatment plan. The right column shows DVHs for a single normal tissue of a typical patient of the patient group in the left column. These DVHs are shown as a function of the fractionation schedule.
