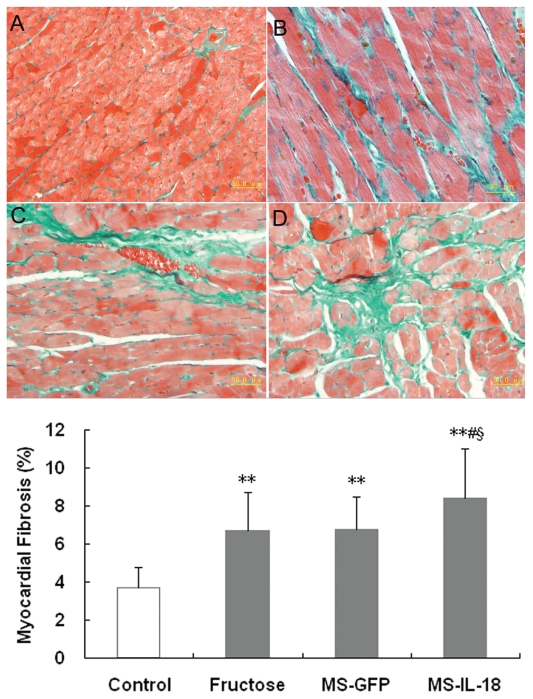
Figure 1.
Histological examination of the myocardium in experimental rats. Collagen volume fraction of the left ventricle in four groups is shown. Top shows representative microscopic image of the myocardium with Masson’s trichrome stain in the control (A), fructose (B), MS-GFP (C) and MS–IL-18 (D) groups (magnification 400×). Lower shows the semi-quantitative evaluation of the collagen volume fraction in four groups of rats. Values are expressed as mean ± SD. **P < 0.01 versus the control group; #P < 0.05 versus the fructose group; §P < 0.05 versus the MS-GFP group. Bar = 50 μm.

