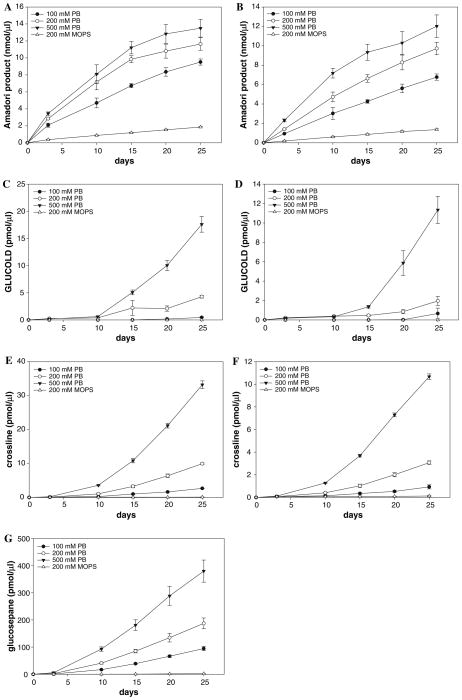
Fig. 5.
Influence of buffer ions [MOPS (200 mM; pH 7.4 with 0.02% sodium azide and 0.2 mM DTPA) versus phosphate buffer (100, 200 and 500 mM; pH 7.4 with 0.02% sodium azide and 0.1, 0.2 and 0.5 mM DTPA, respectively)] and γ-gunidino butyric acid on Amadori product (Panels a, b), GLUCOLD (Panels c, d), crossline (Panels e, f) and glucosepane (Panel g) formation. Panels a, c and e are from glucose (100 mM) and ε-amino caproic acid (100 mM) incubation systems, while panels b, d, f and g from glucose (100 mM), ε-amino caproic acid (100 mM) and gunidino butyric (100 mM) incubation systems. Data are expressed as mean value ± SD (n = 3)

