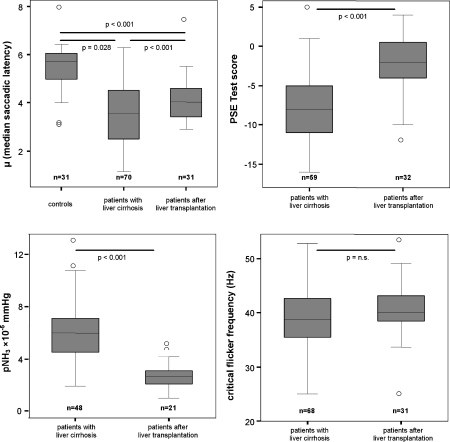
Fig. 1.
Box-Whisker blots for individual surrogate markers of hepatic encephalopathy. The median is indicated by a horizontal line. Boxes indicate the 25th and 75th percentile and whiskers the range. Outliers are marked by circles. For saccadic latency the median of 200 individual saccadic latency times in each patient was calculated and for critical flicker frequency the median of 6 individual measurements in each patient was calculated. (Note that the differences in numbers are due to difficulties in obtaining PSE test results, CFF and pNH3 in some patiens)

