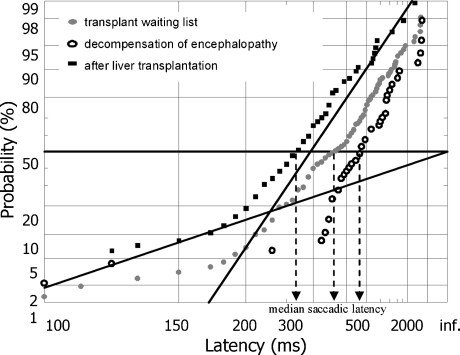
Fig. 4.
Reciprobit plots summarizing the saccadic data from the patient presented in Table 1. The intercept of the 50th percentile and the best-fit line indicates median saccadic latency (projection to the abscissa indicated by the dashed arrows). The slope of the line corresponds to the LATER parameter σ. Note that improvement of mean saccadic latency after transplantation is associated with a shift of the regression line, implying an increase in the LATER parameter σE

