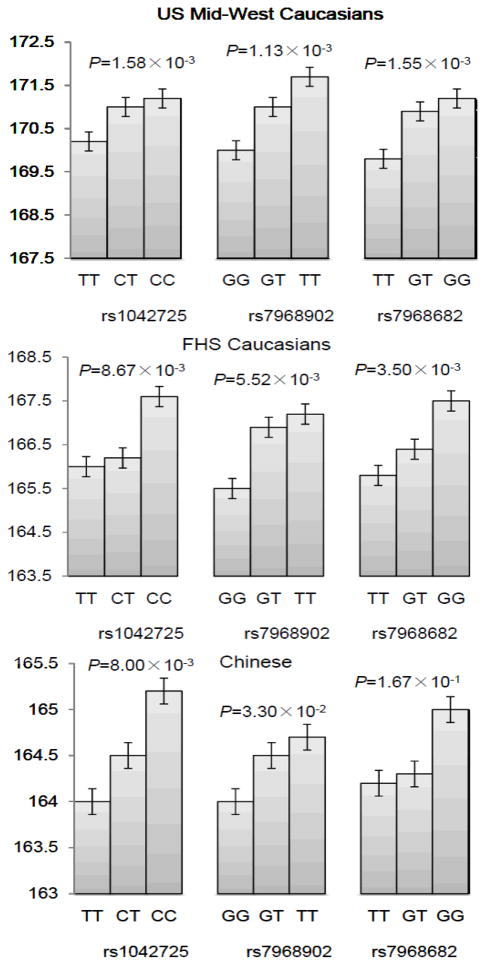
Figure 2.
Comparison of height values among subjects with different genotypes for the three significant SNPs in Caucasians and Chinese.
For the family-based Caucasian sample, we selected 1,518 unrelated subjects including the parents from each family to plot this figure. Error bars denote standard error. P values were calculated by the linear model.

