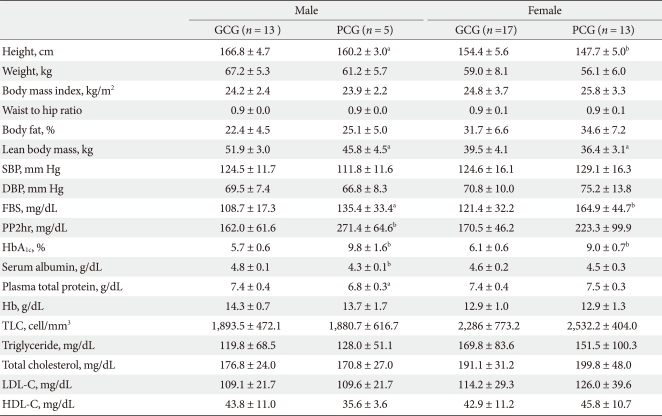
Table 2.
Clinical measurements of T2DM elders with good glycemic control or poor glycemic
Values are presented as mean ± standard deviation. Differences between the GCG and PCG for the same gender at aP < 0.05, bP < 0.01 are by Student's t-test.
T2DM, type 2 diabetes mellitus; GCG, good glycemic control group; PCG, poor glycemic control group; SBP, systolic blood pressure; DBP, diastolic blood pressure; FBS, fasting blood sugar; PP2hr, postprandial 2-hour; HbA1c, glycated hemoglobin; Hb, hemoglobin; TLC, total lymphocyte count; LDL-C, low density lipoprotein cholesterol; HDL-C, high density lipoprotein cholesterol.

