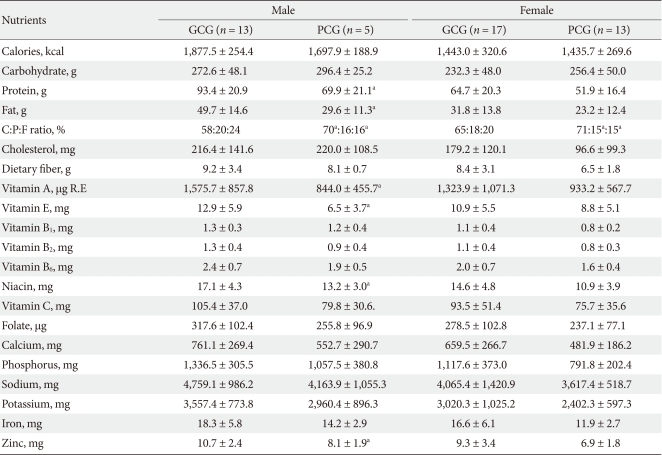
Table 3.
Comparison of average daily nutrient intakes in T2DM elders according to glycemic control
Values are presented as mean ± standard deviation. Differences between the GCG and PCG for the same gender at aP < 0.05 are by Student's t-test.
T2DM, type 2 diabetes mellitus; GCG, good glycemic control group; PCG, poor glycemic control group.

