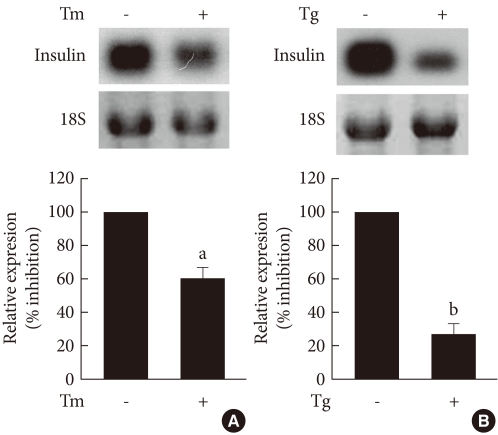
Fig. 1.
The effects of tunicamycin and thapsigargin on insulin mRNA expression in INS-1 cells. Northern blot analysis of insulin mRNA expression in INS-1 cells treated with tunicamycin (A) and thapsigargin (B). INS-1 cells were treated with tunicamycin (2 µg/mL) for 24 hours or thapsigargin (1 µM) for 5 hours. 18S rRNA levels were analyzed as an internal control. Data in bar graph are the mean ± SEM of three independent measurements. aP < 0.01 and bP < 0.001 compared to control.

