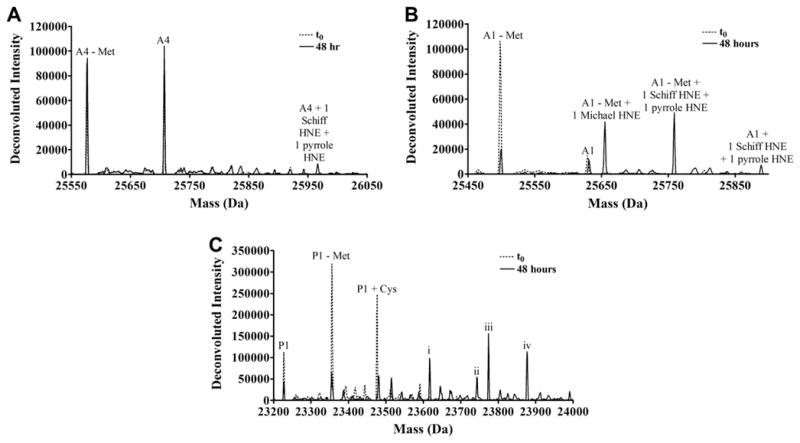
Fig. 4.

Deconvoluted spectra of (A) GST A4-4, (B) GST A1-1 or (C) GST P1-1 incubated with HNE at t0 (blue) and t = 48 h (black). All masses shown are for the monomer. The peaks due to a few of the most abundant species are labeled. GST P1-1 peaks i through iv could result from more than one type of adduct as described in the text.
