
Fig. 1.
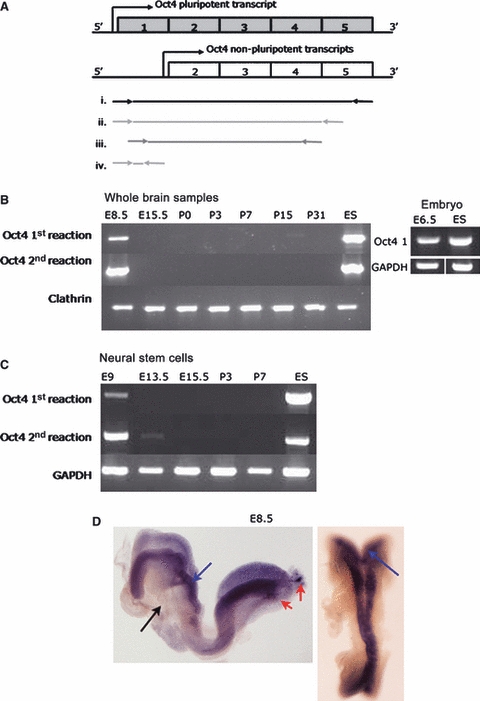
Oct4 expression analysis at embryonic and postnatal stages of brain and neural stem cell development. (A) Schematic representation of Oct4 transcripts. Only the transcript including exon 1 has been shown to play a central role in pluripotency. Primers shown below were therefore designed incorporating exon1. (i) Amplification of full length Oct4 transcript (used in E); (ii) Primary RT-PCR (used in B,C); (iii) Secondary nested RT-PCR (used in B,C); and (iv) QPCR primer locations. (B) RT-PCR from whole brain samples, except E6.5 which were whole embryos and ES cells as positive control. Products are shown from first PCR reaction and after a second nested PCR reaction. Clathrin was included as loading control for the amount of RNA in the reactions. (C) RT-PCR from neural stem cells, all populations used at passage 3–6, ES cells included as positive control. GAPDH included as loading control. (D) Whole mount in situ hybridization using a full length Oct4 riboprobe on E8.5 embyros. Oct4 expression identified in the neural plate (blue arrows) and PGC (red arrows), not in the non-neural tissue (black arrow). E, embryonic stage; P, postnatal stage.