
Fig. 3.
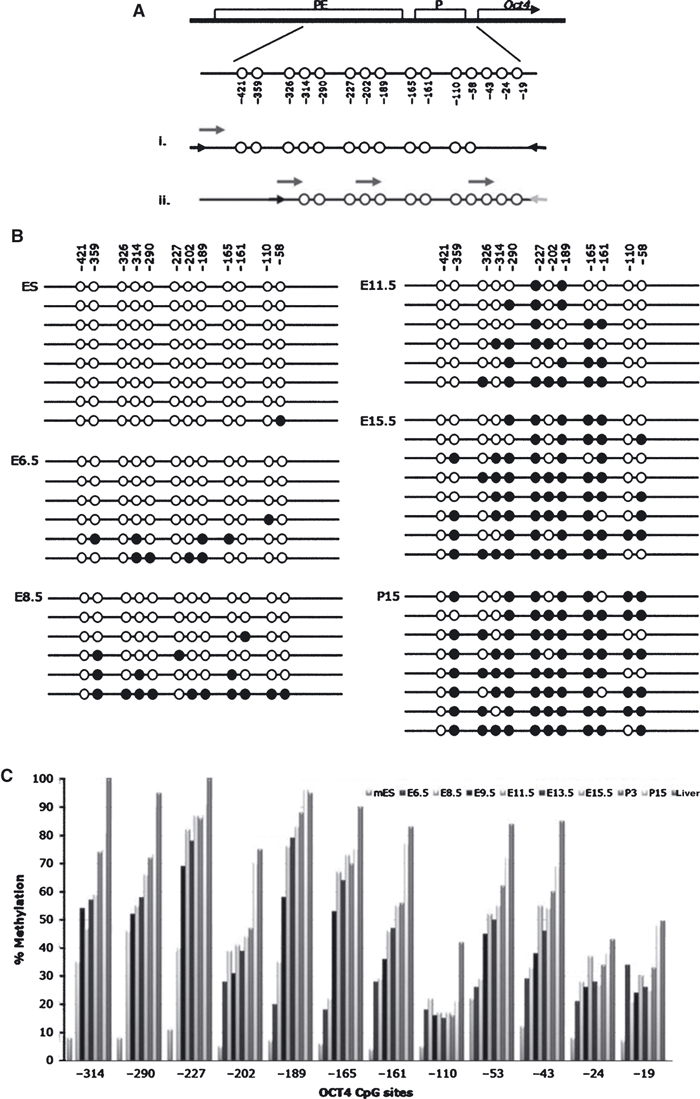
Oct4 DNA methylation analysis of neural stem cells at embryonic and postnatal stages. (A) Schematic representation of the CpG sites within the Oct4 promoter (P) and proximal enhancer (PE). CpGs covered by (i) bisulphite sequencing and (ii) pyrosequencing (locations of primers shown by arrows, PCR primers in black and short arrows above the product represents the sequencing primers). (B) Bisulphite sequencing results on ES cells, E6.5 head, E8.5 head, E11.5 NSCs, E15.5 NSCs and P15 NSCs. Open circles represent unmethylated CpGs, closed circle represent methylated CpGs, with each line representing one sequenced clone. (C) Pyrosequencing results showing percentage methylation at each CpG site from E6.5 head, E8.5 head to embryonic and postnatal NSCs. ES cells and liver used as controls for unmethylated and highly methylated, respectively.