
Fig. 5.
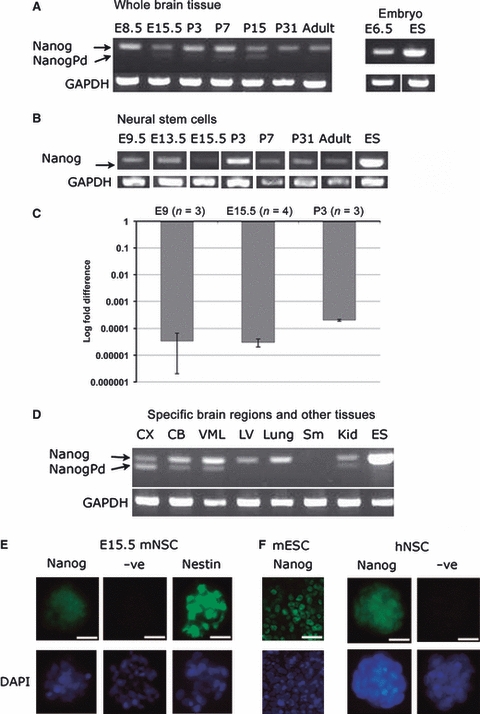
Analysis of Nanog expression and protein localization in neural stem cells. (A) RT-PCR results for whole brain samples showing amplification of Nanog (upper band) and NanogPd pseudogene (lower band). (B) RT-PCR amplification of Nanog and NanogPd showed only Nanog transcript was expressed in mouse neural stem cells. (C) Relative fold change of NANOG expression in neural stem cells compared to ES cells. Each bar represents the average fold change of three independent cultures of cells, with error bars showing SD. (D) RT-PCR results for specific brain regions and other tissues. In all RT-PCR reactions, ES cells were used as the positive control and GAPDH as a loading control. (E) Immunostaining of mouse E15.5 NSC with Nanog, negative control of secondary antibody only and Nestin as a positive control. (F) Nanog immunostaining of human NSCs (hNSCs) with mouse ES (mESC) cells as positive control for nanog expression.