
Fig. 6.
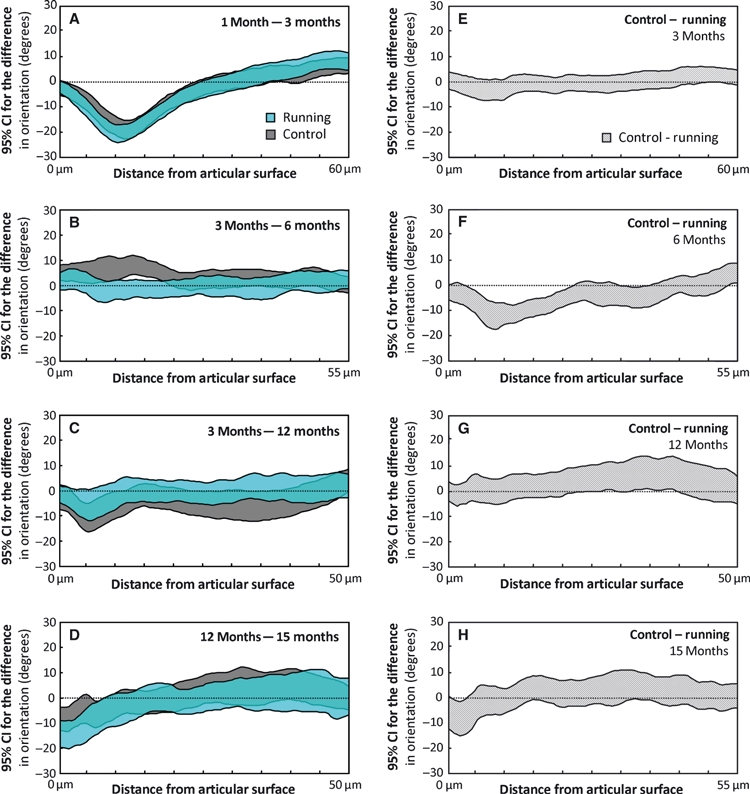
Maturation-dependent changes in the collagen fibril orientation are presented as 95% confidence intervals (CIs) of the difference between consecutive age-groups for both the control and runner groups (A–D). Similarly, the exercise-dependent differences between the controls and runners are presented between ages (E–H). The CIs are presented as a function of tissue depth. The maximum distance from the articular surface depends on the thickness of the specimen within the compared groups. A difference below the value of 0 indicates that the older age-group (A–D) or runner group (E–H) has more collagen fibrils with a perpendicular-to-surface orientation. Due to differences in the exercise modes, the 12-month age-group is not compared with the 6-month age-group, but with the 3-month age-group with similar exercise mode. The differences in each panel should be interpreted according to the title of the panel, e.g. the orientation angle at 1 month of age minus the orientation angle at 3 months of age (A).