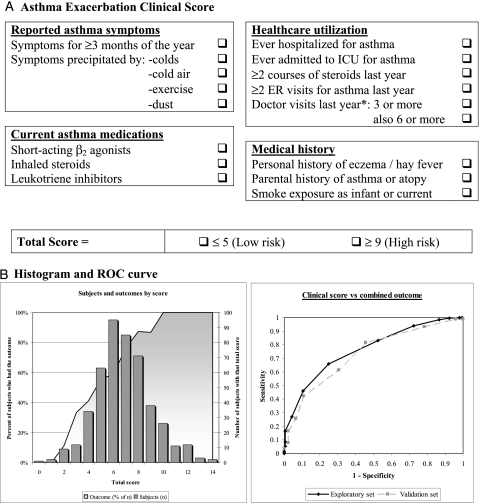
Figure 1.
A, Clinical score instructions: One point is assigned for each question answered as yes. The score is calculated by adding all points (total score range, 0-17). For “Doctor visits last year,” one point is assigned for ≥ 3 visits, and one more point (two total) if the patient also had ≥ 6 visits. B, Histogram of total clinical score with superimposed proportion of children who had the Expert Panel Report 3 (EPR-3) outcome (theoretical range, 0-17; actual range, 0-14; mean ± SD, 6.85 ± 2.5; median, 7; interquartile range, 5-8). ROC curve for the total clinical score and the EPR-3 outcome (area under the curve, 0.78 for the exploratory set and 0.76 for the validation set [dashed line]). ROC = receiver operating characteristic.

