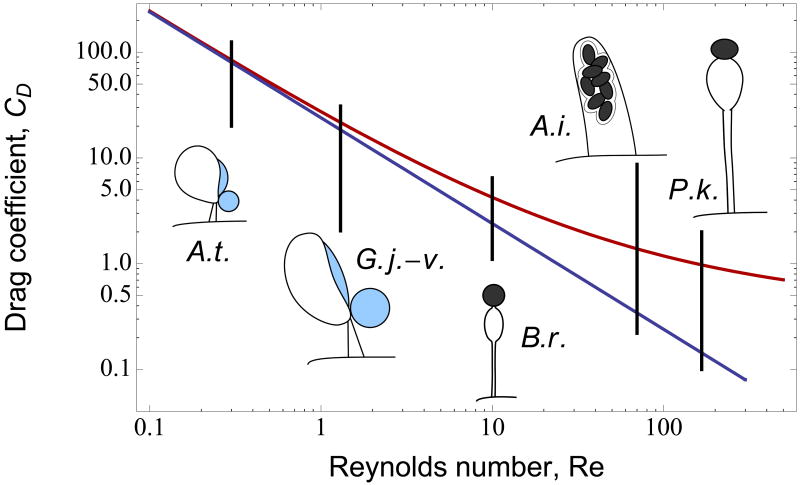
Fig 3.
Relationship between Reynolds number (Re) and drag coefficient (CD) according to simple Stokes model (blue curve) and more complex interpolation model (red curve) for range of Re values corresponding to spore discharge mechanisms evaluated in this study. Divergence between the two models is apparent at Re = 10 (Basidiobolus) and increases at higher Re values (Re = 70 for Ascobolus and 167 for Pilobolus).

