
Figure 1. Elite controllers have lower levels of activated and recently divided HIV-specific T cells than non-controllers.
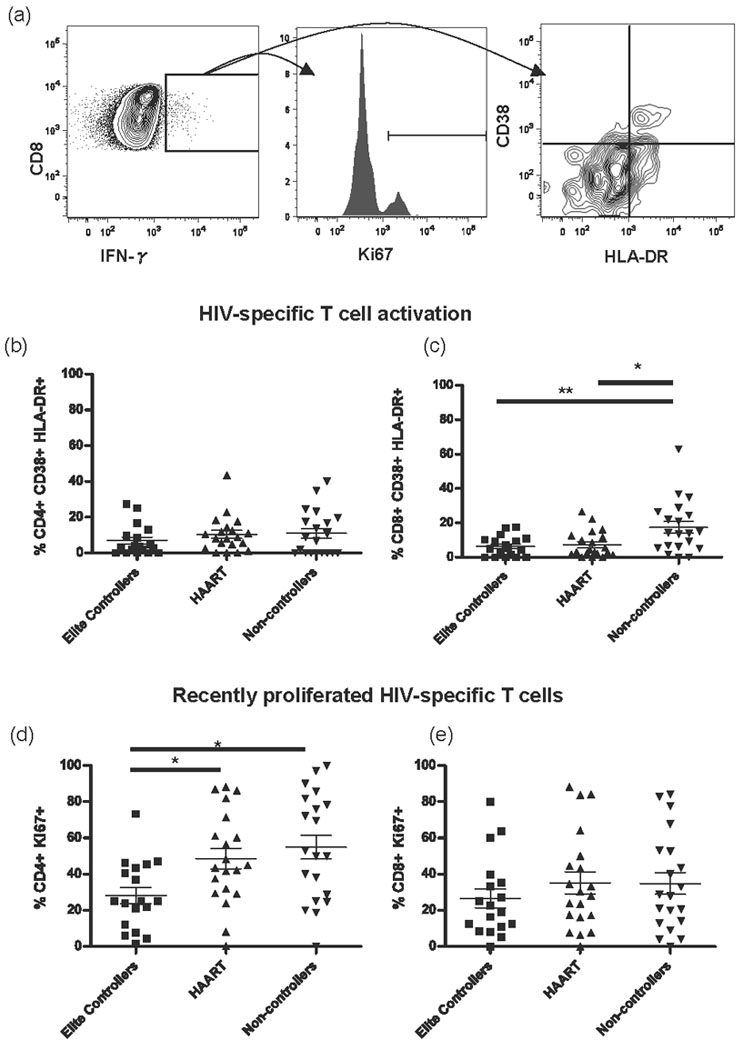
(a) Representative flow cytometry plots of HIV-specific CD8+ T cells illustrate the gating strategy, showing HIV-specific cells (left panel), recently divided cells in a smoothed histogram of Ki67 expression (middle panel), and activation status by CD38 and HLA-DR co-expression (right panel). (b) The percentage of activated CD4+ IFNγ+ T cells and (c) CD8+ IFNγ+ T cells co-expressing CD38 and HLA-DR following HIV p55 stimulation. (d) The percentage of recently divided CD4+ IFNγ+ Ki67+ T cells and (e) CD8+ IFNγ+ Ki67+ T cells following p55 stimulation. * p<0.05, ** p<0.01.