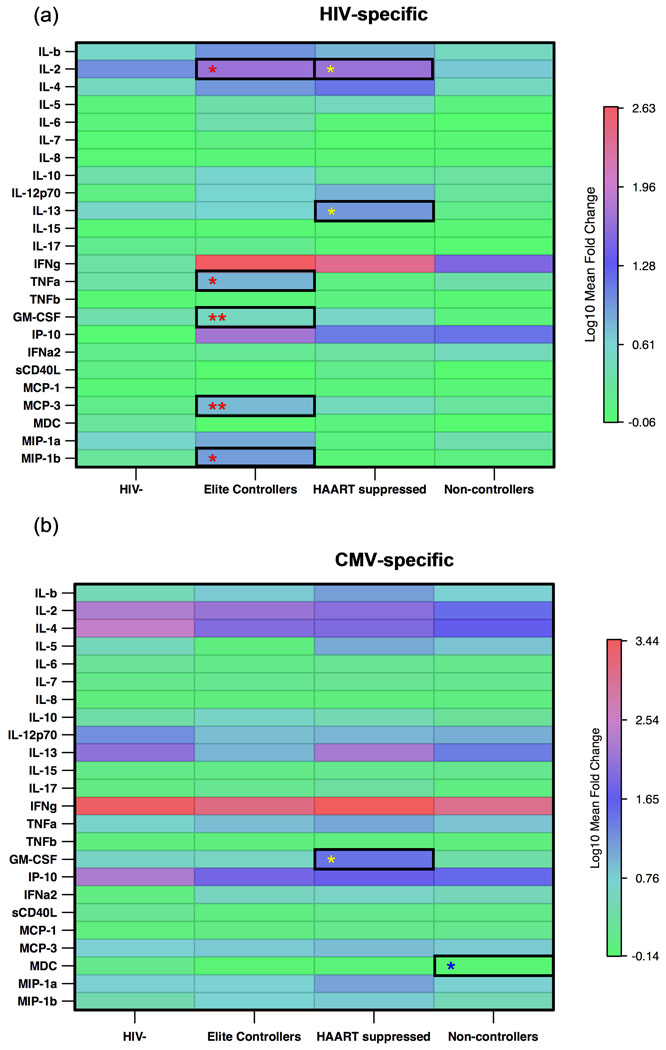
Figure 3. Elite controllers mount a broader and stronger cytokine and chemokine response following HIV-specific stimulation than non-controllers.
Heat map showing the log10 mean fold-change in cytokines and chemokines following (a) HIV p55 stimulation and (b) CMV pp65 stimulation. Progressive increases in log10 mean fold-change are represented by blue to red colors. Significant p values are indicated by asterisks (* p< 0.05, ** p< 0.001), with a red * representing significant differences between the elite controllers and the non-controllers, a yellow * representing significant differences between the HAART suppressed group and the non-controllers, a blue * representing significant differences between non-controllers and HIV uninfected subjects, and a black * representing significant differences between elite controllers and the HAART suppressed group.

