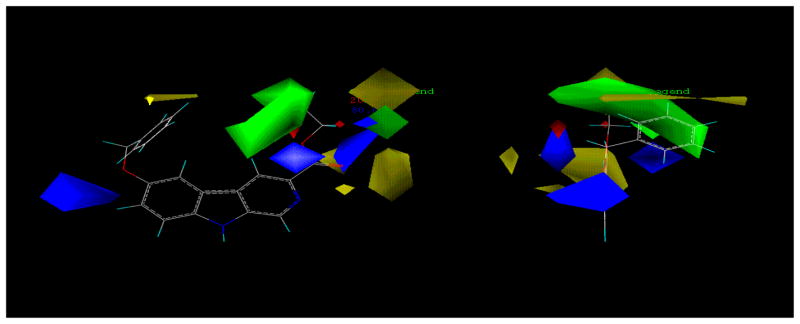
Figure 3.
Orthogonal views of CoMFA contour maps for the affinity of 6-benzyl-substituted β-carbolines at the α1β3γ2 BzR.
Orthogonal view of CoMFA contour maps for the α1β3γ2 receptor subtype with 6-benzyl-substituted β-carbolines modeled by Huang.60 Green contours represent areas of positive steric interaction at a contribution level of 85%, which would result in reduced binding affinity. Blue contours represent areas of positive charge interaction at a level of 85%, which would increase the affinity of a ligand.

