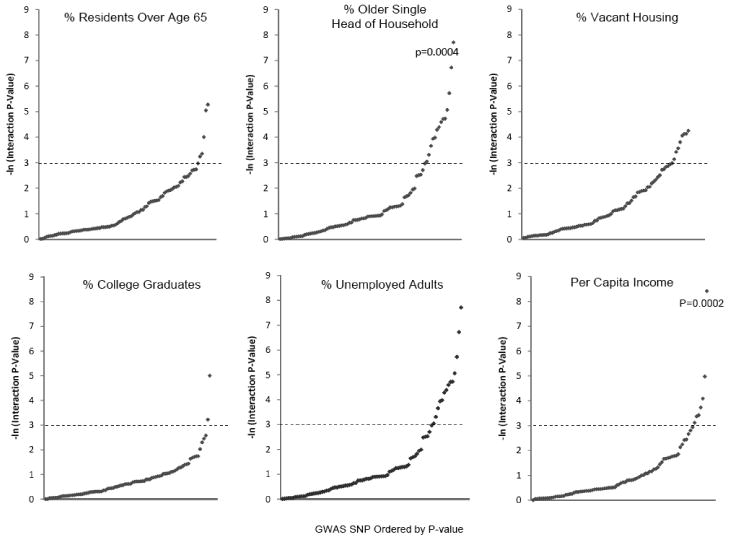
Figure 2. Per-Allele Genotype by macroenvironment variable interaction P-values for time to biochemical (PSA) failure after prostatectomy. Diamonds indicate interaction p-values adjusted for age, and tumor aggressiveness. Dotted line represents interaction p-value of 0.05; p-values indicate statistically significant effects after correction for multiple testing.

