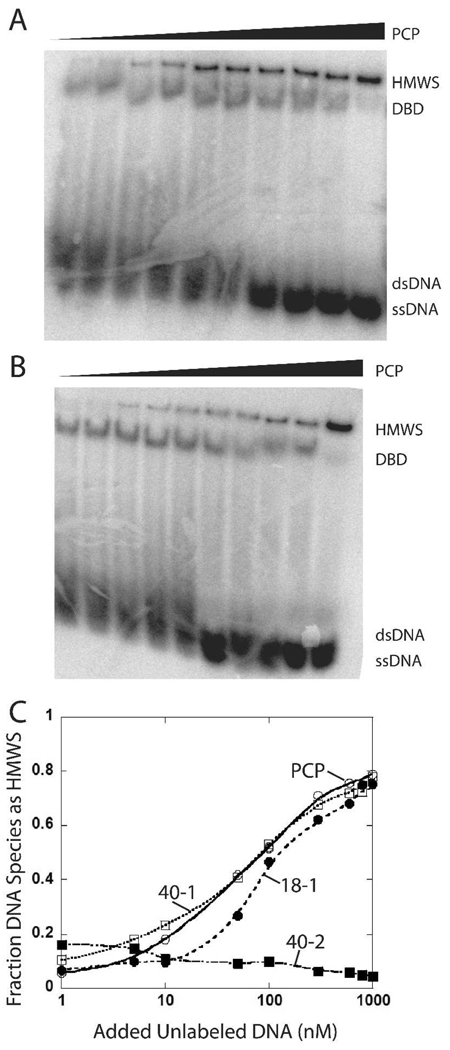
Figure 4.
Native gel electrophoresis of 1 nM 32P labeled 18 bp DNA and 1 µM SgrAI dimer and varied concentrations of unlabeled DNA. A. 1 nM 32P labeled primary site (18-1) with added unlabeled PCP (10, 30, 60, 100, 200, 300, 400, 500, 600, 1000 nM). B. 1 nM 32P labeled secondary site (18-2) with added unlabeled PCP (10, 30, 60, 100, 200, 300, 400, 500, 600, 1000 nM). C. Plot of percent of DNA (1 nM 32P-18-1) bound species with 1 µM SgrAI found in HMWS vs. concentration of added unlabeled PCP (open circles), 40-1 (open boxes), 18-1 (filled circles), or 40-2 (filled boxes).

