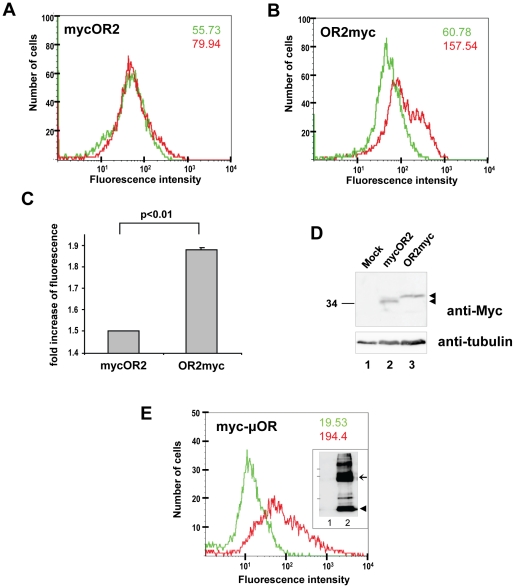
Figure 5. Flow cytometric analysis of expression of Myc-tagged OR2 on the surface of Bm5 cells.
(A) N- or (B) C-terminally Myc-tagged OR2 were stably expressed in Bm5 cells in the presence of flagOR7 and analyzed by FACS for the extracellular localization of the Myc tag. For each panel, the green tracing and number represent fluorescence values obtained from the staining of the cells with only the FITC labelled secondary antibodies, while the red tracing and number represent values obtained from cells incubated with both the primary anti-Myc and the FITC labelled secondary antibodies. Increased fluorescence intensity (2.59-fold over the background value) was observed for the C-terminally Myc-tagged receptor in comparison to the receptor that was Myc-tagged at the N-terminal end (1.43-fold over the background value). (C) Values (increases over background) indicated in this panel represent the mean ± S.E.M. of three independent experiments. (D) Western blot analyses of whole cell lysates from the stable cell lines used for FACS analysis and control, mock-transformed cells, probed with anti-Myc (upper) and anti- tubulin (lower) antibodies. (E) FACS analysis of cells expressing the N-terminally Myc-tagged µ-opioid receptor used as a positive control for the extracellular localization of the Myc tag. Green and red tracing/numbers are as in panels A and B. Inset shows the detection of µOR in these cells by western blotting with the anti-myc antibody. The arrowhead and the arrow point to major bands detected (putative monomer and dimer, respectively), while the positions of 50, 90 and 118-kDa molecular mass markers are indicated at left.

