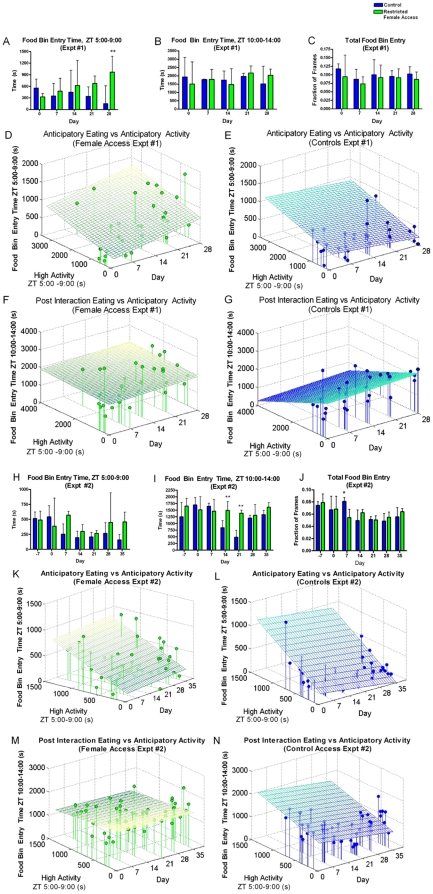
Figure 3. Examination of eating behavior in mice with restricted female access.
(A) For social experiment #1, the sum of the number of seconds control mice (dark blue) enter the food bin during the four hours prior to the interaction time and the number of seconds that mice with restricted female access (green) spent entering the food bin during the four hours prior to the interaction time. (B) For social experiment 1, the sum of the number of seconds mice enter the food bin during the four hours after the interaction time. (C) For social experiment 1, the fraction of frames during the entire duration of the recording in which the mice showed food bin entry. Analysis of correlations between eating and activity across experiments #1 and #2. (D) The total number of seconds that each restricted female access mouse spends entering the food bin in the four hours before female access (ZT 5-9) is plotted against the number of seconds of high activity in the four hours before female access (ZT 5-9) and the time point in the experiment (days 0, 7, 14, 21, and 28). The best-fit plane is shown (R = 0.6609, p = 0.0004). (E) The total number of seconds that each control mouse spends entering the food bin in the four hours before feeding (ZT 5-9) is plotted against the number of seconds of high activity in the four hours before feeding (ZT 5-9) with the best-fit plane shown (R = 0.3688, p = 0.0960). (F) The total number of seconds that each restricted female access mouse spends entering the food bin in the four hours after female access is plotted against the number of seconds of high activity in the four hours before female access and the time point in the experiment with the best-fit plane shown (R = 0.1208, p = 0.8201). (G) The total number of seconds that each control mouse spends entering the food bin in the four hours after feeding is plotted against the number of seconds of high activity in the four hours before feeding across the experiment (R = 0.3282, p = 0.2146). (H) For social experiment #2, the sum of the number of seconds control mice enter the food bin during the four hours prior to the interaction time. (I) For social experiment #2, the sum of the number of seconds mice enter the food bin during the four hours after the interaction time and (J) represents the fraction of total time across the entire video recording that the mice entered the food bin. (K) The total number of seconds that each restricted female access mouse spends entering the food bin in the four hours before female access (ZT 5-9) is plotted against the number of seconds of high activity in the four hours before female access (ZT 5-9) across the entire experiment (days 0, 7, 14, 21, 28, and 35), showing the best-fit plane (R = 0.5058, p = 0.0013). (L) The total number of seconds that each control mouse spends entering the food bin in the four hours before feeding (ZT 5-9) is plotted against the number of seconds of high activity in the four hours before feeding (ZT 5-9) across the experiment showing the best-fit plane (R = 0.5640, p = 0.002). (M) The total number of seconds that each restricted female access mouse spends entering the food bin in the four hours after female access is plotted against the number of seconds of high activity in the four hours before female access showing the best-fit plane (R = 0.1565, p = 0.5723, p = 0.8201). (N) The total number of seconds that each control mouse spends entering the food bin in the four hours after feeding is plotted against the number of seconds of high activity in the four hours before feeding across the experiment showing the best-fit plan (R = 0.4019, p = 0.0190). For panels A–C and H–J * = p<0.05, ** = p<0.01, *** = p<0.001, Mann-Whitney Test. n = 8 at all time points. All bar graphs represent median and the upper quartile of the interquartile range.

