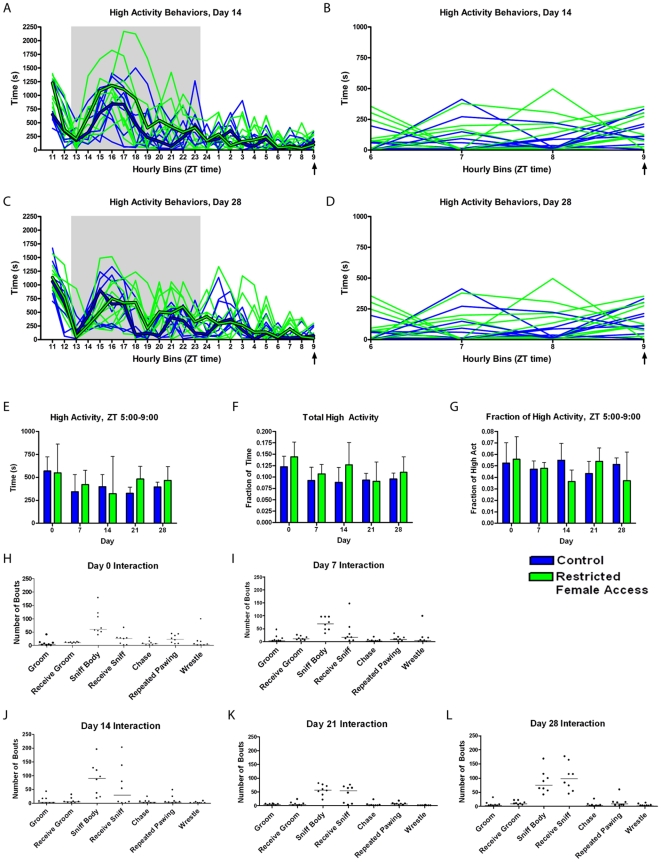
Figure 5. Characterizing the anticipatory activity of female mice with one hour of restricted access to a stable female partner daily (“Experiment #3”).
(A) The number of seconds in each hourly bin of high activity behaviors (walking, jumping, rearing, and hanging) that occurred on day 14 of restricted female access. Thin weight green lines represent data from individual mice with restricted female access while blue lines represent the controls. Median values are shown in thick green and blue lines for experimental and control mice, respectively. The gray area depicts the 11 hours of lights off. (B) An enlarged presentation of ZT 5 to 9, the four hours preceding female access, in panel A, to show the variance in the anticipatory behavior. (C) The number of seconds in each hourly bin of high activity behaviors that occurred on day 21 of the experiment. (D) An enlarged representation of bins 6 to 9 (which includes data from ZT 5-9) in C. (E) The number of seconds in each hourly bin of high activity behaviors (walking, jumping, rearing, and hanging) during the last four hours prior to restricted female access. (F) Fraction of frames during the entire duration of the video recording (∼23 hrs) during which the mice exhibited any high activity behavior. (G) Normalized high activity data in the four hours preceding restricted female access. The number of seconds spent in high activity behavior during the last four hours prior to female access divided by the total number of seconds of high activity across the entire 23 hour recording. Quantifying the social interaction during the restricted female access period. The number of bouts in which each female mouse interacted with its respective female partner by grooming, being groomed, sniffing the body, being sniffed, chasing, repeated pawing, or wrestling on day 0 (H), day 7 (I), day 14 (J), day 21 (K), and day 28 (L). Each point on the scatter plot represents the number of instances in which an individual mouse exhibited that behavior. The solid horizontal line represents the median value.

