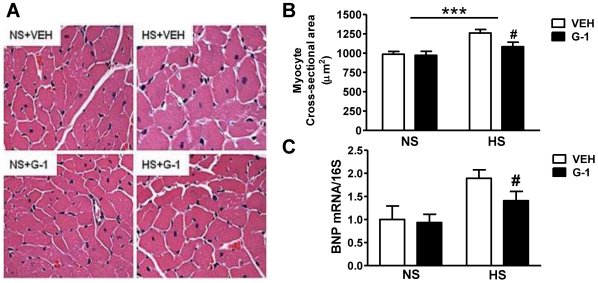
Figure 3. GPER activation with G1 limits salt-induced myocyte hypertrophy.
a. Representative hematoxylin and eosin staining outlining cardiomyocytes. b. Quantification of myocyte cross-sectional area. Data represent mean ± SEM. *** P<0.001 (Salt effect); # P<0.05 (G-1 effect). c. Cardiac BNP gene expression determined by real-time PCR and expressed as the ratio of BNP mRNA to S16 ribosomal RNA. # P<0.05 (G-1 effect).

