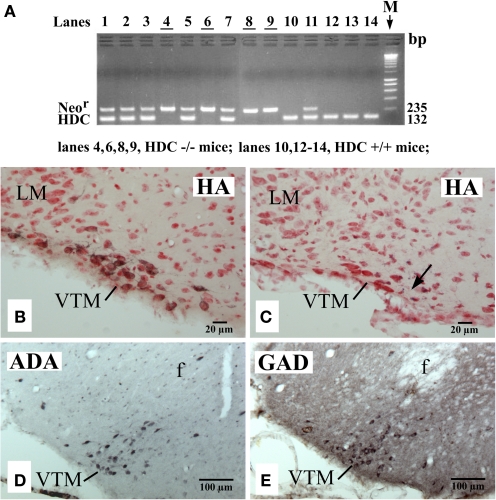
Figure 2.
PCR confirmation of genotypes (A) and photomicrographs showing the distribution of VTM HA neurons in a WT (HDC+/+) mouse (B), of VTM neurons lacking histamine in a HDC-KO (HDC−/−) mouse (C), and of VTM neurons immunoreactive for ADA (D) or for GAD67 (E) in a HDC-KO mouse. In (A), note that all HDC+/+ mice displayed a 132-bp band corresponding to the HDC gene fragment, whereas all HDC−/− mice showed a 235-bp band corresponding to the Neor gene fragment. In (B,C), the sections are counterstained with neutral red. The arrow in (C) indicates the recording site of a W-specific neuron. Note that in (B,C), the sections are from the caudal region of the VTM corresponding to the caudal magnocellular nucleus consisting of large cells that form a compact group along the basal mammillary region (Figure 1C). Note also that in (D,E), the sections are from the middle region of the VTM (Figure 1B) and are adjacent to each other.

