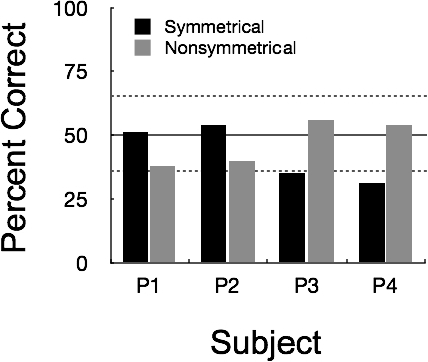
Fig 3.

Matching accuracy for individual pigeons during the first 96-trial session of Symmetry Test 1. Black bars represent accuracy on symmetrical trials with the Set 1 stimuli and gray bars represent accuracy on nonsymmetrical trials with the Set 2 stimuli. Dashed lines show the 95% confidence interval associated with random responding (normal approximation to binomial).
