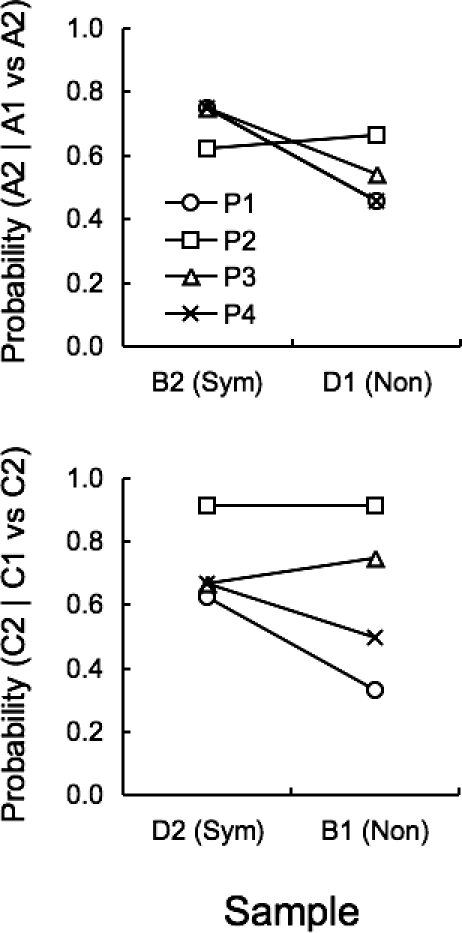
Fig 6.

Probability of choosing A2, given a choice between A1 and A2 (top panel), and probability of choosing C2, given a choice between C1 and C2 (bottom panel), as a function of sample, during the 96-trial session of the Symmetry Test 2. Each curve corresponds to an individual pigeon.
