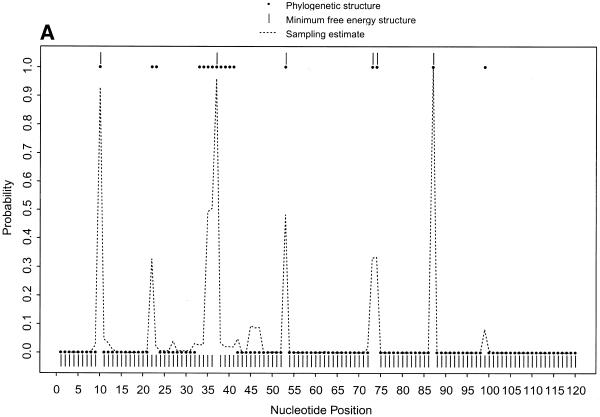
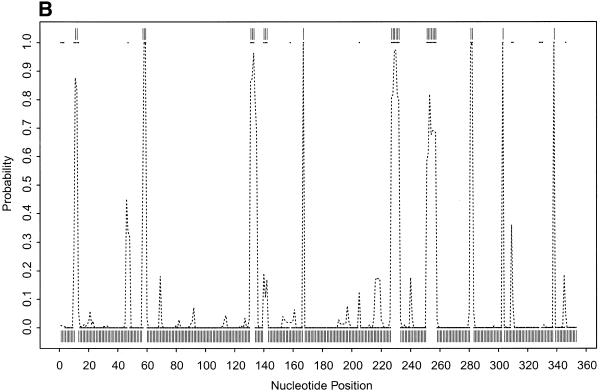
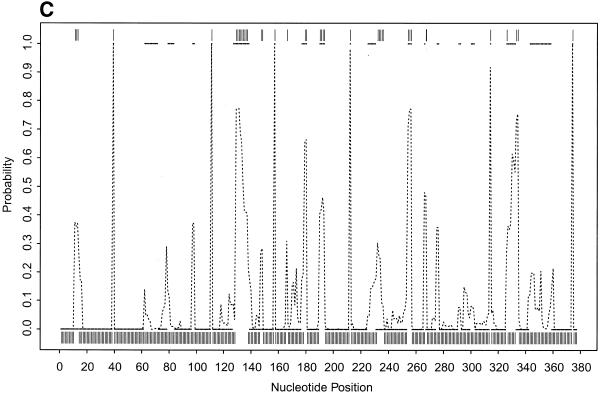
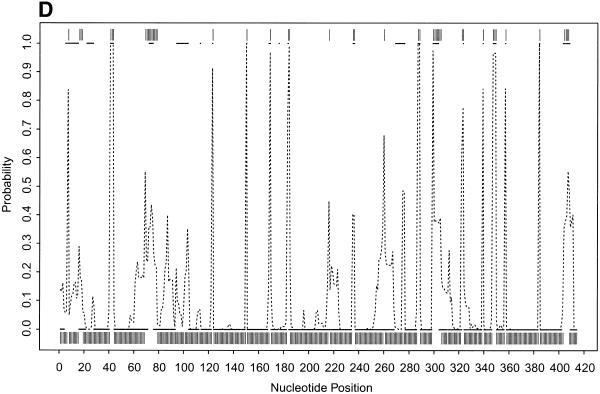
Figure 2.
(Opposite and above) Probability profiles (sequence width W = 4) for other representative RNA sequences, with sampling estimates computed from 1000 sampled secondary structures. For X.laevis oocyte 5S rRNA (A, opposite), the large dots present the profile indicated by the phylogenetic structure, the dashed line is the sampling estimate and the vertical bars represent the minimum free energy structure. For E.coli 16S rRNA domain II (B, opposite), E. coli RNase P (C, above) and Group I intron from 26S rRNA of T.thermophila (D, above), the small solid squares (adjacent squares appear to form line segments) present the profile indicated by phylogenetic structure, the dashed line is the sampling estimate and the vertical bars represent the minimum free energy structure. For the Tetrahymena Group I intron, a 6 bp double-stranded region called P3 (38) in the phylogenetic structure is not considered here because of the creation of a pseudoknot. The current sampling algorithm needs to be extended to predict certain types of pseudoknots.


