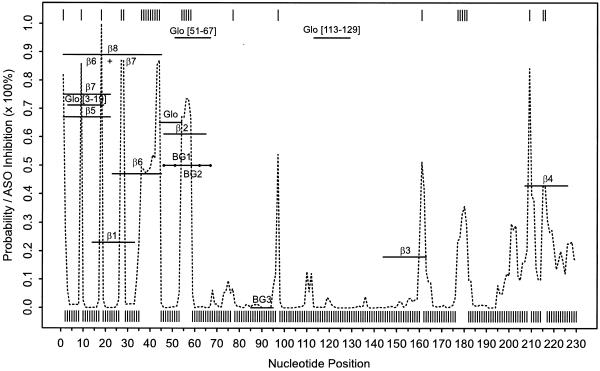
Figure 3.
The probability profile for single-stranded sequences of four consecutive nucleotides (sequence width W = 4) estimated by 1000 sampled secondary structures (dashed line) and the profile indicated by the minimum free energy structure (vertical bars) for rabbit β-globin mRNA and the experimentally measured inhibition of ASOs in cell-free translation systems. The profile is shown for the region of the first 230 nt that is targeted by the ASOs. The length and binding sites of the ASOs are indicated by horizontal lines with the names of the ASOs centered above or below the lines. These lines also indicate the inhibition of translation through their position on the vertical axis. The vertical axis also shows the probability for the profile with inhibition corresponding to probability multiplied by 100%.

