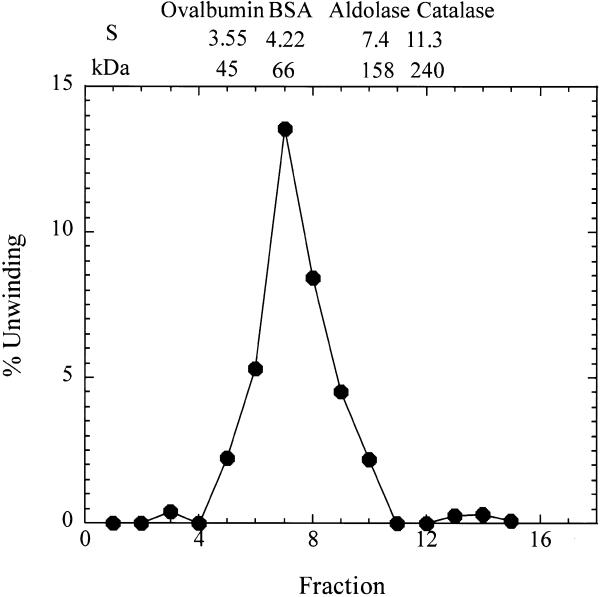
Figure 3.
Glycerol gradient (15–35%) sedimentation analysis of 100 µl of Fraction 310 000 g for 20 h at 4°C). The distribution of helicase activity and the position of sedimentation and Mr markers are shown. The markers were catalase (250 kDa, 11.3S), aldolase (158 kDa, 7.4S), BSA (66 kDa, 4.3S) and ovalbumin (45 kDa, 3.5S).

