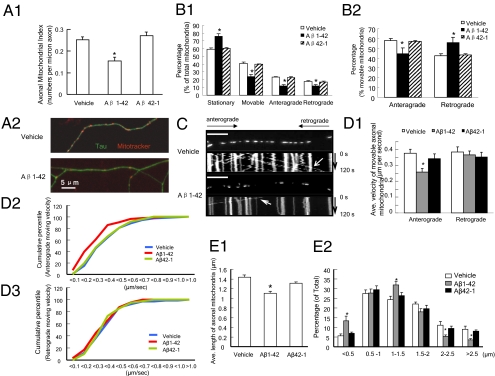
Fig. 5.
Effect of Aβ on mitochondrial distribution and trafficking in axons. (A) Axonal Mitochondrial Index (numbers per micron in axon) after Aβ1-42 (200 nM) treatment for 24 h on cultured hippocampal neurons. (A1) Data were collected from three independent experiments. *P < 0.05 vs. other groups. (A2) Representative images for vehicle- or Aβ-treated axonal mitochondrial distribution. Double-immunostaining with Mitotracker (red, mitochondrial marker) and Tau (green, axonal marker) was performed. (B) Axonal mitochondria trafficking in cultured non-Tg hippocampal neurons. Data were collected from 1,176, 546, and 563 mitochondria from vehicle, Aβ1-42, and Aβ42-1 groups, respectively, in four independent experiments. (B1) Percentages of stationary, moveable, anterograde-transported, and retrograde-transported mitochondria were compared with those of total mitochondria, respectively. (B2) Percentages of anterograde-transported and retrograde-transported mitochondria were compared with the total amount of movable mitochondria, respectively. *P < 0.05 vs. other groups. (C) Representative kymograph images of the vehicle and Aβ1-42–treated axonal mitochondrial movement. (Scale bars = 10 μm.) (D) Mitochondrial velocity. (D1) Average anterograde and retrograde transport velocity of movable mitochondria (μm/s) is shown. *P < 0.05 vs. other groups. Cumulative data for the anterograde transport velocity (D2) and retrograde transport velocity (D3) are shown. (E1) Average length of axonal mitochondria in micrometers. *P < 0.05 vs. other groups. (E2) Distribution of mitochondrial length.

