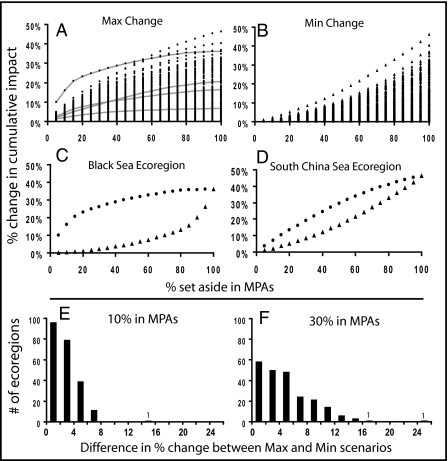
Fig. 3.
Change in ecoregion-scale cumulative impact under different portions of area are set aside in no-take reserves (i.e., all fishing is prohibited within those areas). In each of 232 ecoregions (identified by each point), scenarios were analyzed with the portions of the region with the greatest (A) and least (B) impact of fishing were converted to no-take reserves. Results for four example ecoregions are connected with gray lines (A) to illustrate different shapes and magnitude of change with increasing proportion of no-take reserves. (C and D) Results for two specific ecoregions illustrate differences when no-take reserves are designed to include the greatest (circles) and least (triangles) impacted areas. (E and F) Histograms show the difference in the change in total cumulative impact between the scenarios where no-take reserves are placed in the areas with greatest and least impact from fishing within each ecoregion, at 10% (E) and 30% (F) total area set aside in no-take reserves. Histogram bars with a single ecoregion are noted with “1” to aid in identification.

