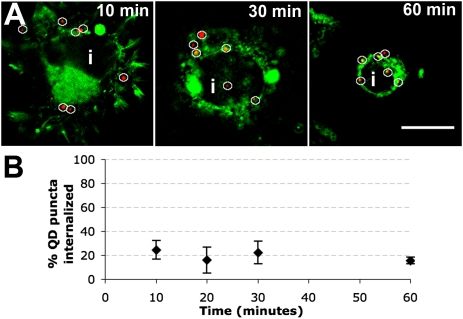
Fig. 2.
Internalization of QD-HA-5-HT1A in the absence of 5-HT stimulation over time. (A) Images showing the subcellular location of QD-labeled HA-5-HT1A in transfected N2a cells at progressive time points after QD probes were introduced. Red, QD probe; green, DiO, membrane dye; i, cellular interior. Images depict one slice of a z-stack. (Scale bar, 10 μm.) (B) Plot of the cellular internalization of QD puncta with time in the absence of 5-HT. Data are presented as mean ± SD.

