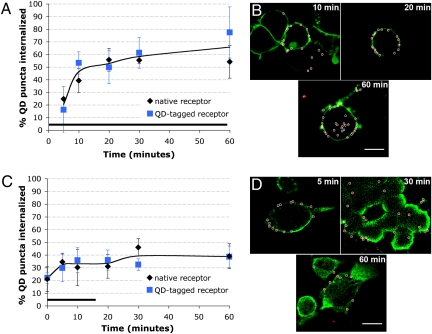
Fig. 3.
Kinetics of ligand-induced receptor internalization monitored by single groups of QD-tagged 5-HT1A receptors. (A) Plot of internalized QD puncta as a function of time during continuous 5-HT stimulation of transfected N2a cells. Data are presented as mean ± SD. Bar represents duration of 5-HT stimulation. (B) Images depicting cellular internalization of QD probe during continuous 5-HT activation. HA-5-HT1A receptors were either prelabeled with QDs before 5-HT treatment (“QD-tagged receptor” experiment) or postlabeled with QDs after fixation and permeabilization (“native receptor” experiment). A representative QD-tagged receptor experiment is shown. Red, QD probe; green, plasma membrane, visualized with DiO. Images represent one slice in a z-stack. (Scale bar, 10 μm.) (C) Plot of the cellular internalization of QD puncta during and after a 15-min pulse of 5-HT. Data are presented as mean ± SD. Horizontal black bar represents the duration of the 5-HT activation. (D) Images depicting cellular internalization of QD probe with 15-min stimulation of 5-HT. A representative native receptor experiment is shown. Red, QD probe; green, plasma membrane, labeled via immunocytochemistry with α-pan-cadherin. Images represent one slice in a z-stack. (Scale bar, 10 μm.) Fig. S3 displays statistical information for the data in A and C.

