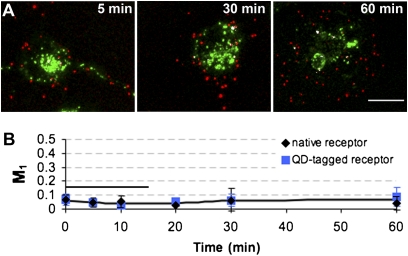
Fig. 5.
Lysosomal trafficking of 5-HT1A receptors measured with QDs. (A) Colocalization between QDs (red) and LAMP1 (green) after 15-min stimulation with 5-HT (QD-tagged receptor experiment is shown; native receptor experiment images are similar). (B) Colocalization between QDs and LAMP1 was analyzed as described in Fig. 4D. Horizontal black bar indicates duration of 5-HT exposure. All images are a maximum projection of a z-stack. White pixels indicate colocalization. (Scale bar, 10 μm.)

