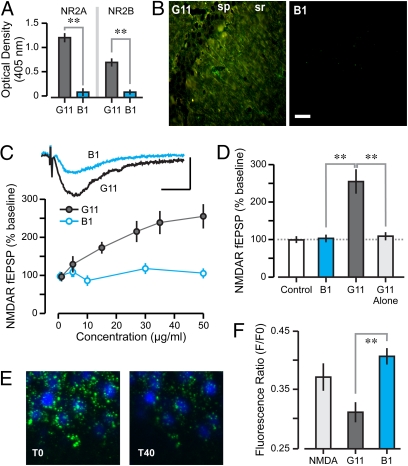
Fig. 5.
Human NMDAR-reactive AAb, G11, binds NMDARs, enhances NMDAR-mediated synaptic responses and augments mPT. (A) Optical density values (mean ± SD), measured on ELISAs, for binding of G11 (5 μg/mL, n = 12) and control Ab B1 (5 μg/mL, n = 12) to NR2A and NR2B. Student t tests reveal significant binding for G11 vs. B1 (NR2A, T = 8.2; NR2B, T = 5.2; **P < 0.001). (B) CA1 neurons treated with DNase and stained with G11 and B1 (each at 10 μg/mL) followed by FITC-conjugated secondary Ab; G11 section is also stained with Ab against glutamate. (Scale bar: 20 μm.) sp, stratum pyramidale; sr, stratum radiatum. (C) Graph shows NMDAR-mediated fEPSPs (mean ± SEM) at increasing concentrations of G11 and B1 (n = 10–12 per level). ANOVA reveals a significant concentration effect for G11 vs. B1 (F = 9.8, P < 0.05). (Inset) Traces recorded after 10-min exposure of G11 or B1 (each at 50 μg/mL). [Scale bar: 0.5 mV (y axis), 50 ms.] (D) Graph (mean ± SEM) shows enhancement of NMDAR-mediated fEPSPs by G11 (50 μg/mL, n = 12), null effect of the innocuous Ab, B1 (50 μg/mL, n = 10), and lack of enhancement by G11 in the absence of synaptic stimulation (G11-alone, n = 10). Student t tests reveal significant differences (B1 vs. G11, T = 4.7; G11 vs. G11-alone T = 4.2; **P < 0.01). (E) Sample fields of CA1 before (T0) and 40 min after (T40) treatment with NMDA and G11. (Scale bar: 10 μm.) (F) Decrease in calcein fluorescence at T40, expressed as F/F0 ratios (mean ± SD). Notice the clear mPT amplification in the G11 group. B1 fails to enhance mPT (B1 vs. G11, T = 4.4, **P < 0.001, t test).

