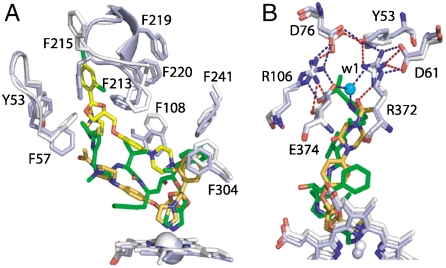
Fig. 7.
Comparison of ritonavir- and ketoconazole-bound CYP3A4. The structures are rendered in white and light blue, respectively. (A), Relative orientation of ritonavir (green), ketoconazole molecules (yellow and orange) and the interacting aromatic residues. (B), Conformational differences around the polar “umbrella.” Blue and red dotted lines represent electrostatic/H-bonding interactions in the ritonavir- and ketoconazole-ligated CYP3A4, respectively.

