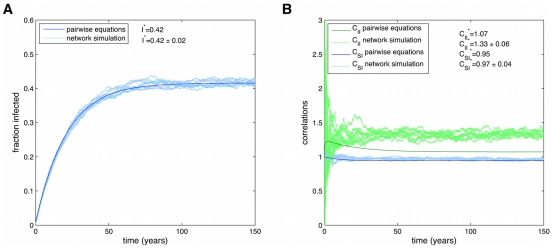
Figure 5. Simulations of obesity epidemic using SISa model.
Time series of an epidemic on the Framingham Heart Study network, using full simulations (light blue) or the n-regular pair-wise equations (dark blue). Parameters used are those measured for the obesity epidemic:  . In the SISa model there is a co-existence of susceptible and infected individuals at steady state. For these parameters there is a good agreement with simulations and the pair-wise equations for the fraction infected (A), but the equations predict less correlations (B), due to the neglect of heterogeneities in the number of contacts.

