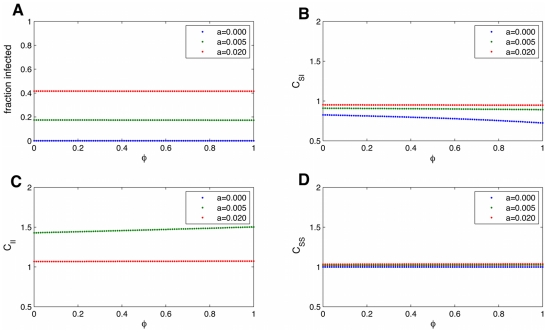
Figure 13. Dependence of the equilibrium fraction infected and correlations on the network transitivity,  .
.
The dependence of the equilibrium fraction infected(A) and correlations ( :(B),
:(B),  :(C),
:(C),  :(D)) measured from the pair-wise equations on the network transitivity,
  . For the parameters measured for the transmission of obesity, shown here, there is no strong dependence on
  . Hence for studying the obesity epidemic it is justified to ignore
  to simplify calculations. Parameters are
  .
.

