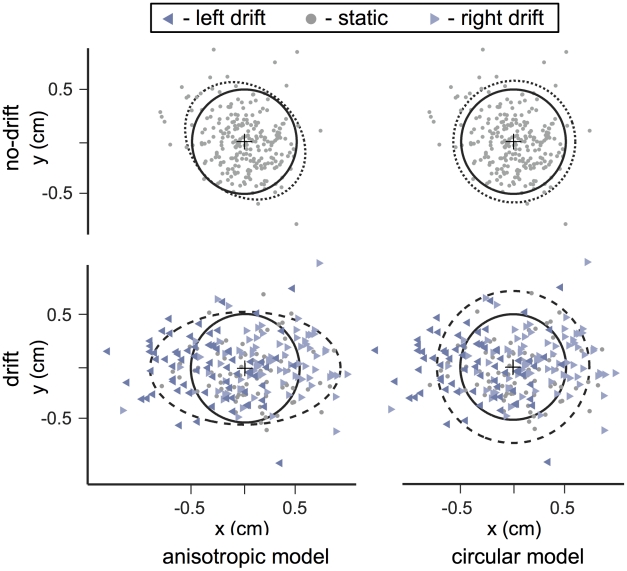
Figure 2. Effects of movement perturbation on movement endpoints.
Movement endpoints are shown for subject S4 for zero-penalty trials aiming at the green target circle. Solid circles represent the 1 cm target region. Upper row: no-drift session. Lower row: drift session. Left column: dotted and dashed curves are 2-SD covariance ellipses. Right column: Dotted and dashed curves are 2-SD circles of an isotropic Gaussian fit to the data. Different symbols indicate the drift condition.

