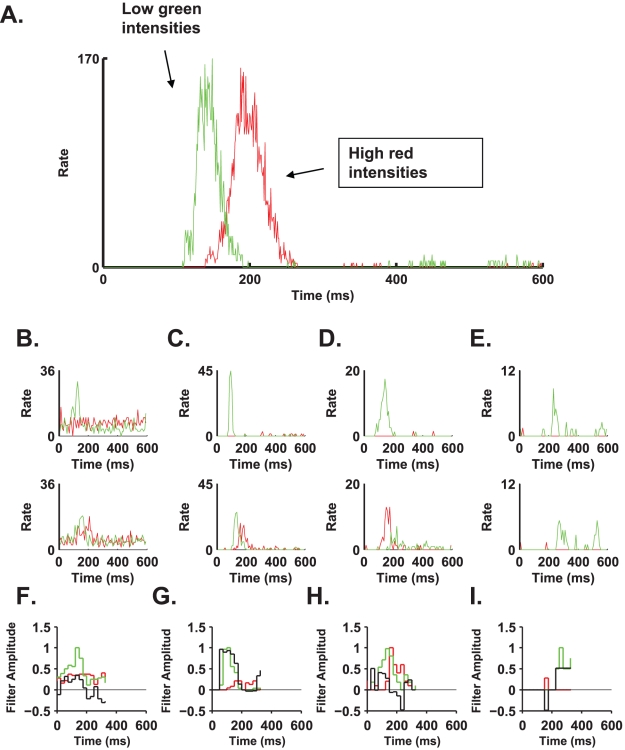
Figure 3. The interplay between intensity and cellular response.
A. Here we present a PSTH of a ganglion cell, which reports on flash colour with high (90%) accuracy. The cell responded to red flashes in the intensity range of 0.55–0.65 µW/cm2 and to green flashes in the range of 0.22–0.32 µW/cm2 with a very similar response profile, although shifted in time. This is an indication that the flash onset signal is important in enabling the extraction of flash colour identity. B–E. The same as in A for the four cell examples in Figure 2 B–E: the top panels show PSTHs for high green intensities and low red intensities, whereas the bottom panels show PSTHs for low green intensities and high red intensities. F–I. The temporal filters (black) and PSTH in response to different colour flash (red and green) that were used to estimate stimulus colour using the linear-nonlinear readout, based on the responses of the four cells as shown in panels B–E of Figures 2.

