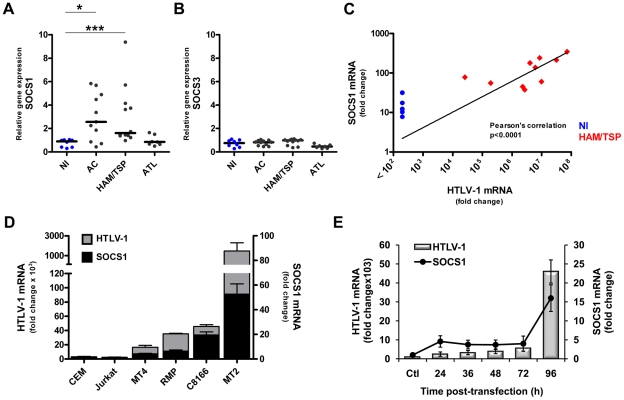
Figure 2. HTLV-1 infection results in the induction of SOCS1 mRNA levels in ex vivo CD4+ T cells and correlates with HTLV-1 mRNA expression.
(A, B) Comparison of mRNA expression of SOCS1 and SOCS3 in CD4+ T cells from HTLV-1 infected and NI patients. CD4+ T cells were isolated from PBMCs of HTLV-1 infected and NI patients; SOCS1 (A) and SOCS3 (B) mRNA levels were assessed using a human cDNA array. SOCS1 gene expression was stratified by clinical status forming 4 groups: NI, ATL, AC and HAM/TSP. Each point represents SOCS level from one individual, with black bars showing median value in each group. Mann-Whitney test was used to compare intensity of SOCS expression between groups (*, p<0.05; ***, p<0.001). (C) Expression of SOCS1 mRNA levels correlated with HTLV-1 mRNA load in HAM/TSP patients. CD4+ T cells from HAM/TSP and NI patients were lysed and total RNA was subjected to reverse transcription. cDNA was analyzed by quantitative real time PCR to assess mRNA levels of SOCS1 and HTLV-1 (Pearson's correlation p<0.0001, line represents log-log non-linear fit of the data) (D) Expression of SOCS1 and HTLV-1 mRNAs was measured in HTLV-1-carrying T cell lines (MT-2, MT-4, C8166, RMP) vs. HTLV-1-negative T cell lines (CEM, Jurkat). Cells were treated as previously and cDNA was analyzed by quantitative real time PCR to measured SOCS1 and HTLV-1 gene expression. Equivalent mRNA amounts were normalized to GAPDH gene expression and calculated as fold change with the levels of uninfected CEM cells set arbitrarily as 1. (E) PBMCs from healthy individuals were electroporated with either HTLV-1 provirus (pX1M-TM) or control empty vector (ctl). At the indicated times, total RNA was extracted and analyzed for SOCS1 and HTLV-1 gene expression. Equivalent mRNA amounts were normalized to GAPDH mRNA expression and calculated as fold change from the levels of control cells that were arbitrarily set as 1.

