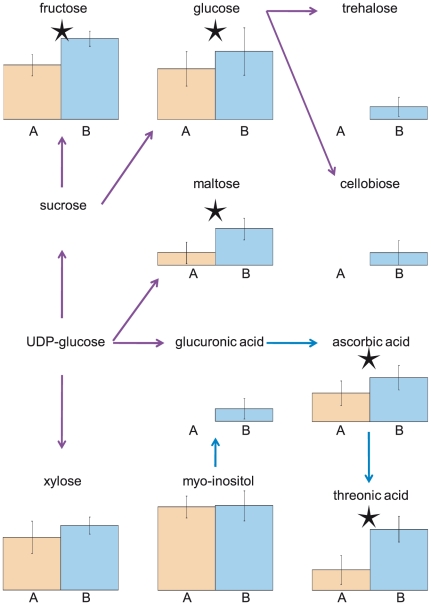
Figure 1. Metabolites in the Starch and Ascorbate pathways are more abundant in Expt. B (collected at PM) compared to Expt. A (collected at AM).
Shown are the average metabolite levels across 96 accessions in Expt. A (orange) and Expt. B (blue). Error bars denote one standard deviation and asterisks denote significant and greater than two-fold difference between experiments. Purple arrows denote starch and sucrose metabolic pathway members and blue arrows correspond to the ascorbate metabolic pathway.

