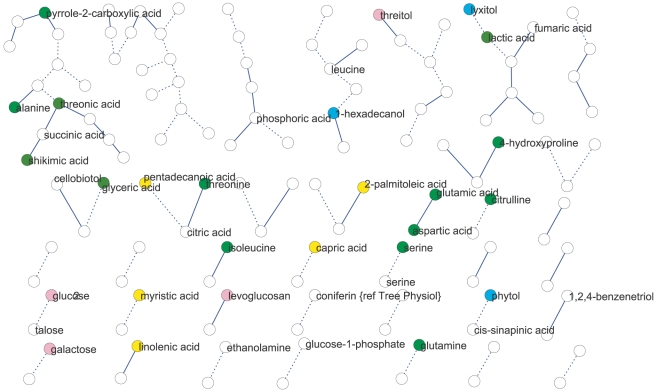
Figure 2. Metabolic network for Expt. A generated from significant (local FDR<20%) partial correlations between metabolites.
Metabolites are represented by nodes (circles) and significant metabolite-metabolite connections are represented by edges (lines). Solid lines define positive connection and dotted lines indicated negative correlations. Colors of circles indicate: amino acids (bright green), fatty acids (yellow), carbohydrates (pink), hydroxy acids (dark green), alcohols and polyols (blue).

