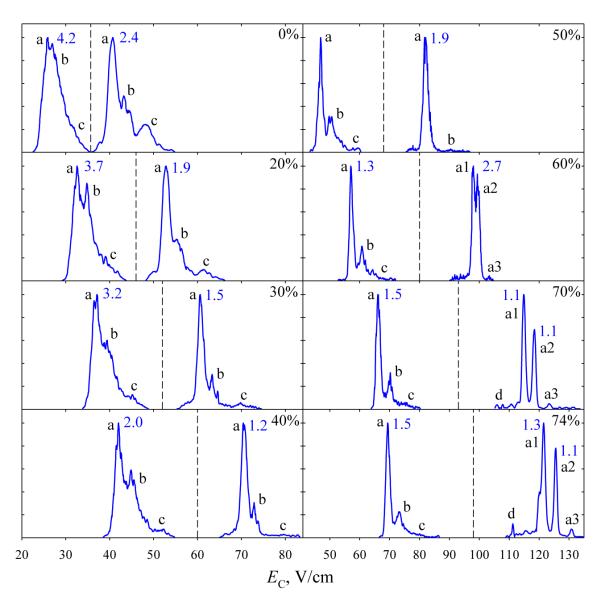
Fig. 1.
Spectra of 3 with z = 2 (left of the dashed line) and 3 (right of the line) at DV = 4 kV at 0 - 74% He, as labeled. The widths at half maximum (V/cm) are given for the major well-shaped peaks. The conformer labels in this and further figures are specific to a particular peptide and charge state.

