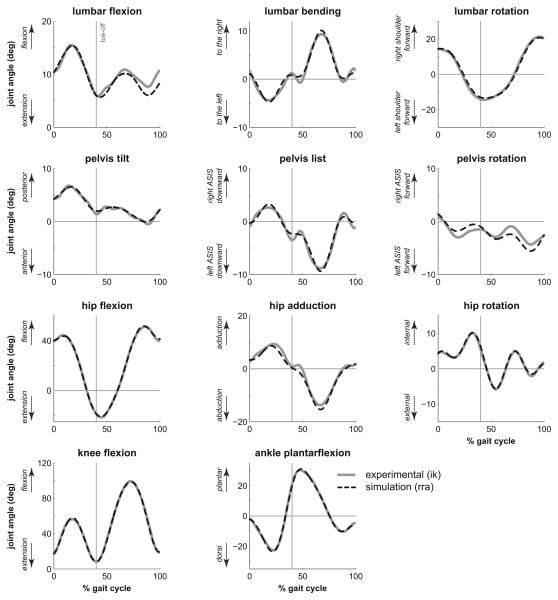
Figure 2.
Kinematics of the back, pelvis, and lower extremities during the running gait cycle. The gray line represents experimental joint angles calculated by inverse kinematics, while the dashed line represents simulated joint angles produced by computed muscle control. Toe-off is indicated by a vertical line at 40% of the gait cycle.

