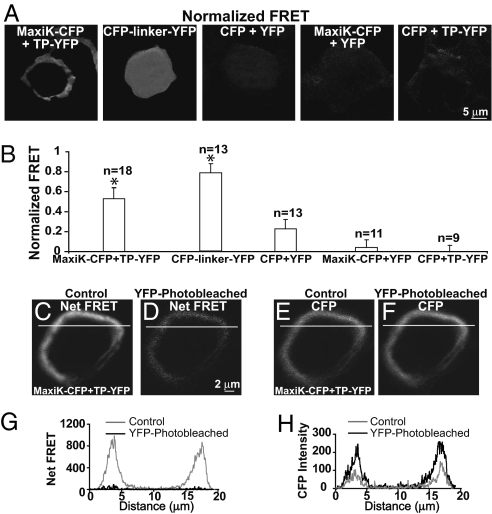
Fig. 2.
FRET between MaxiK–CFP and TP–YFP. (A) Normalized FRET in HEK293T cells coexpressing: MaxiK–CFP + TP–YFP; positive control, CFP-linker-YFP; and negative controls, CFP + YFP, MaxiK–CFP + YFP, and CFP + TP–YFP. (B) Mean normalized FRET values. *Significantly different from negative controls (P < 0.01). (C and D) Net FRET in cells coexpressing MaxiK–CFP + TP–YFP before (control) and after photobleaching with 491-nm laser (YFP-photobleached). (E and F) MaxiK–CFP emission (excited at 405 nm and measured at 465 nm) before (control) and after photobleaching (YFP-photobleached). Lines, regions used to generate line-scan graphs showing decreased net FRET (G) and increased CFP (H) intensity after YFP photobleaching.

